
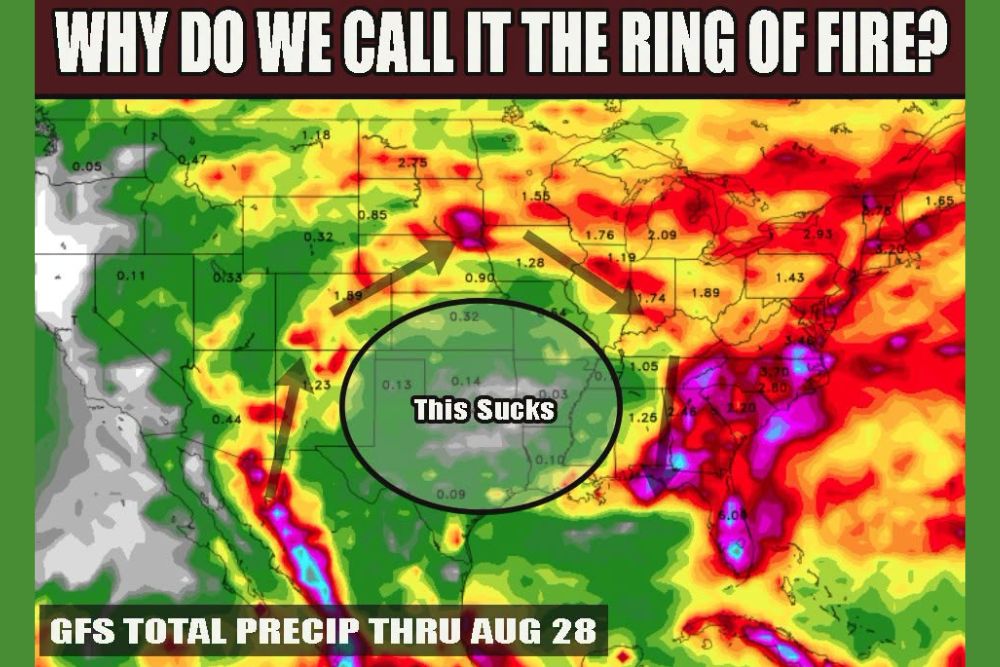
TEXAS — A common summer pattern known as the ring of fire is firmly entrenched across Texas and the South this August, driven by a heat dome sitting as a large area of high pressure over the region. Air flows clockwise around this dome, and along its edge, jet energy in the form of wind shear is able to tap the hot, humid air trapped inside the dome, creating a combination that fuels repeated rounds of storms.
Clockwise Flow Around Heat Dome Drives Storm Track
The mechanics behind the ring of fire pattern center on the clockwise flow of air around the entrenched heat dome. This circulation carries jet energy along the dome’s outer fringes, where it interacts with the hot, humid, and largely stagnant air trapped underneath the ridge itself.
This interaction between the wind shear riding the edge of the dome and the moisture-rich air beneath it is precisely what storms feed on, explaining why the heaviest rainfall consistently develops in a curved band tracing the perimeter of the high pressure system.
GFS Total Precipitation Map Shows Extreme Contrast Through August 28
Total precipitation guidance through August 28 illustrates the pattern clearly, with a broad arc of heavy rainfall, some areas exceeding 5 inches, tracing from the Southwest through the Plains and into the Midwest and Northeast. Meanwhile, the center of the heat dome itself remains remarkably dry.
Areas including Kansas, Oklahoma, and the Texas Panhandle sit squarely within the driest zone highlighted on the map, with projected totals in some spots as low as a tenth of an inch through the end of the forecast period.
Same Areas Face Repeated Rounds as Pattern Refuses to Budge
The ring of fire pattern can be slow to move, repeatedly slamming the same areas with multiple rounds of storms, a trend that has been the case lately across portions of the storm track. This repetitive nature means communities along the ring face compounding rainfall totals while those inside the dome see essentially no relief.
The Midwest and interior Northeast, including areas stretching toward the Ohio Valley and Great Lakes, show some of the highest cumulative precipitation totals on the map, consistent with sitting directly along the favored storm track around the dome’s edge.
Understanding the Pattern Helps Explain Ongoing Summer Extremes
This explainer highlights why some regions have faced an unusually active stretch of storms this August while others, particularly those trapped under the heat dome itself, have seen persistent dry and hot conditions with little relief in sight.
Residents across the central United States are encouraged to understand this pattern as it continues to influence both storm frequency along the ring and the ongoing dry stretch for areas caught underneath the dome through the rest of August.

Leave a Reply